
In the summer of 2022, we conducted a case study to investigate whether share prices have increased more by the elevated valuation levels or by the improved money-making of the companies we own. We analyzed the companies’ earnings growth (EPS) in the Sifter Fund and compared them to the valuation level (P/E) changes in five years’ time.
The past five years have been more than a rollercoaster in the stock market. The strong growth years in 2019 and 2021 were a wonderful time for an investor, but then the stock market crashes in 2018, 2020, and 2022 have been nerve-breaking for some investors.
It’s been a confusing time for an investor. Some financial media and experts have been warning about too-high stock valuations and others about great buying opportunities.
Despite all the noise, the stocks have produced very well.
For example, during the last five and a half years (January 1, 2017-June 30, 2022) in euros.
- OMX 25 index +51.1%
- S&P 500 index +66.8%
- Sifter Fund +70.3%
We researched eight companies that we have owned for more than five years
We examined Sifter portfolio companies: Alphabet (Google), Microsoft, The North West Company, Taiwan Semiconductor Manufacturing Company (TSMC), Texas Instruments, Lam Research, Johnson & Johnson, and Cisco Systems.
The chosen companies represent the characteristics of the Sifter fund’s quality companies. The average ownership period of the Sifter Fund’s typical holding is 4-5 years. Therefore, not all companies in the portfolio were suitable for the study.
We studied changes in companies’ money-making ability, valuations, and share prices.
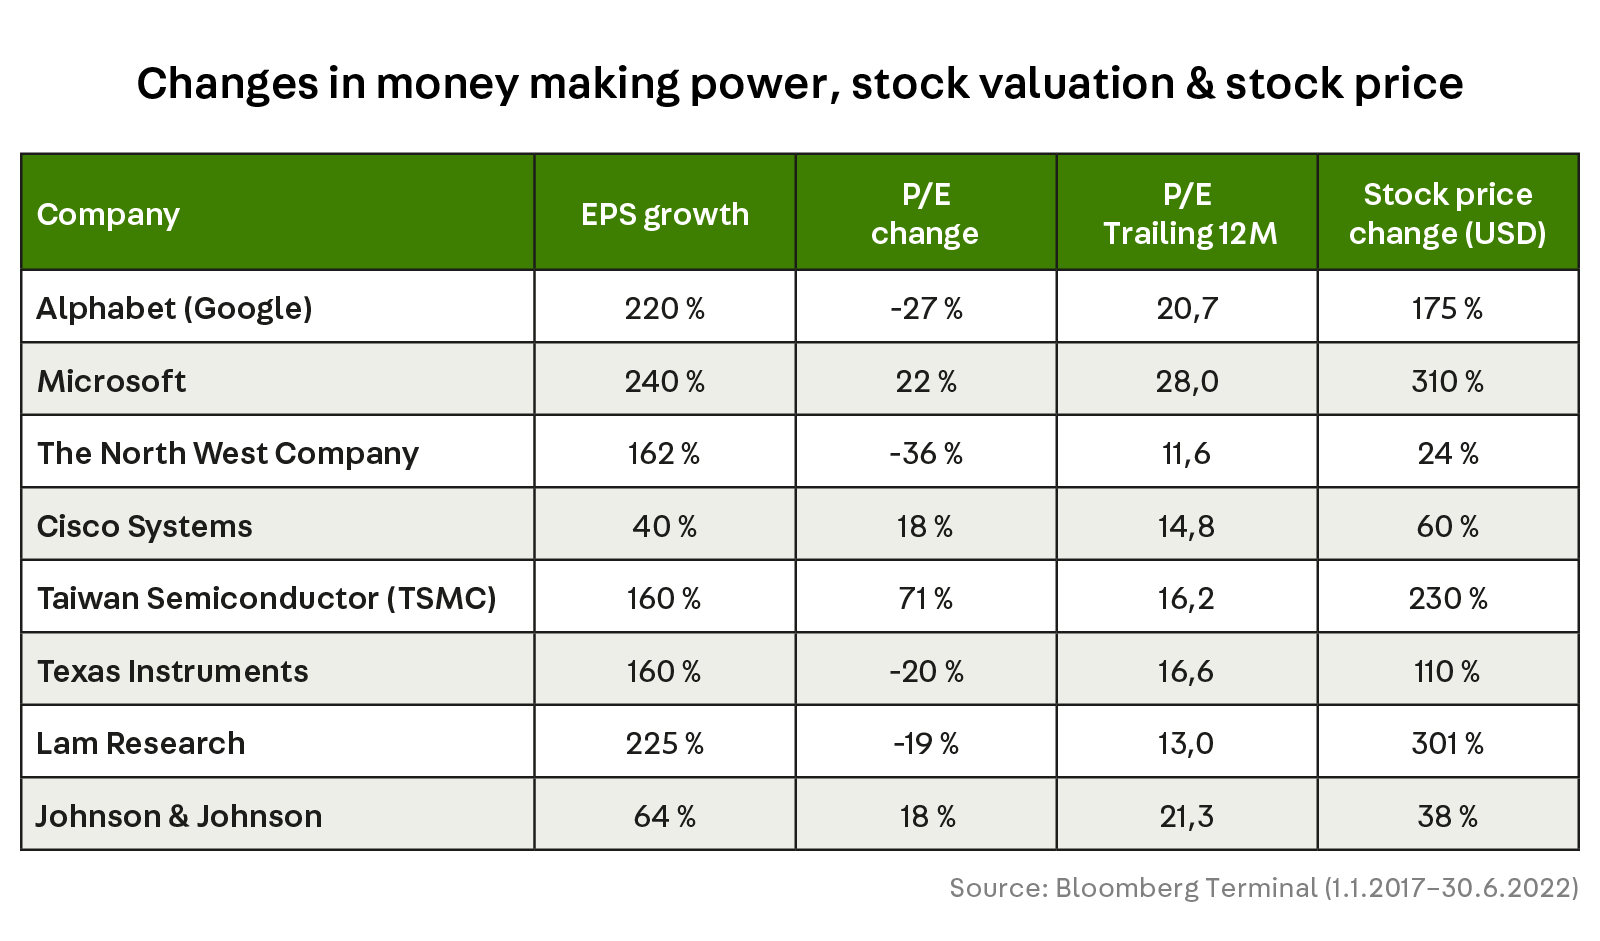
The companies’ earnings have grown faster than the valuation levels
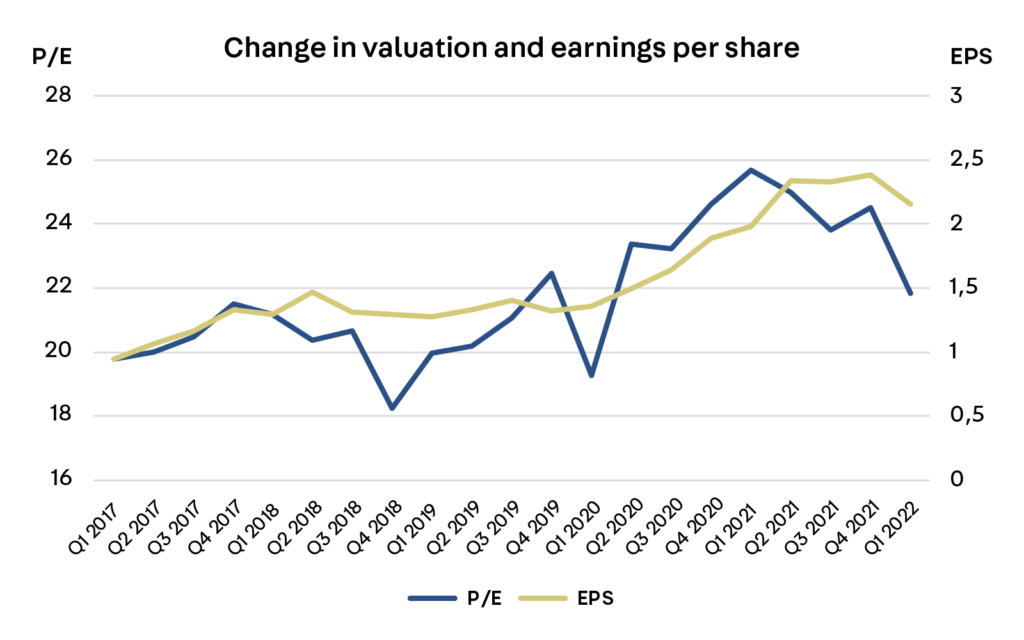
The graph below shows our eight companies’ earnings per share (EPS) growth compared to valuation level (P/E) change. The primary considerations are:
- Earnings per share (EPS) have increased by an average of 130%
- The valuation ratio (P/E) has only increased by 10%
Disclaimer: Examined companies have been part of Sifter Fund’s portfolio for at least five years. Source of all data used: Bloomberg Terminal. All currencies are in USD. EPS refers to Diluted EPS Ex-Amortization, Adjusted on the Sifter Portfolio graph and to basic earnings per share on the S&P 500 graph. The price-to-earnings ratio (P/E) refers to the last price to trailing 12 months’ EPS. None of the information in the presentation shall be considered investment, legal, or tax advice.
What does this mean in practice?
- Based on the research, since 2017, the earnings per share (EPS) increased 2.3-fold, i.e., the companies’ profits have grown significantly.
- Correspondingly, the valuation level indicator (P/E) has increased by 10% or 0.1 times during the same period (P/E from 20 to 22).
- Although stock prices have risen significantly during that time, the companies’ profits have grown even more.
- The graph shows how in 2021, the P/E indicators turned downward. The lowering P/E ratio was mainly due to increasing earnings (E). Correspondingly, in the spring of 2022, P/E continued to fall primarily because of the falling share prices (P). Of course, it is worth noting that the companies have done massive share buybacks, which have also improved earnings per share growth.
So are the stocks cheap?
The research does not directly answer that question because investors accept different valuation levels at different times. In 2017, the valuation levels (P/E) of the studied companies in the Sifter portfolio were, on average, 20, and they have risen “only” 10% by the end of June 2022 on average 22.
In the same period, for example, the five-year cumulative return of the Sifter fund has been 70.3%.
In other words, Sifter investors have received excellent returns mainly because the companies’ money-making has grown significantly, so the returns should not be unjustified.
At the same time, however, it is good to note that historically, during the last hundred years, the average P/E number of the US S&P 500 index has been around 16.
The higher valuation levels of the past five years have been explained, for example, historically by low-interest rates.
However, does the average P/E figure tell the whole truth? There are still dozens of very cheap (1-2 P/E) companies in the market, and of course, Tesla-kind-of-stocks, whose valuations exceed 100 P/E. The average is not a good indicator in turbulent markets.
Are you interested in more detailed insight?
The research report is a 22-page presentation that contains company-specific insights. In addition, we look at whether US technology companies are too expensive and what does the semiconductor industry’s moneymaking look like?
Sifter needs your contact information to stay in touch with you. You can leave our registers at any time. To find out more about our commitment to your privacy, read our Privacy Policy.
What did we learn from the study?
First, it is gratifying to notice that colossal quality companies like Microsoft or TSMC can increase their profit by tens of percent yearly.
Secondly, even if the company’s share price has tripled, there is no need to give up the share if the company’s money-making ability has increased simultaneously and the valuation levels have not increased too much.
Thirdly, we also learned that it is not a good idea to make too quick conclusions due to momentary declines in the share price or valuation level. The nature of the market involves trying to predict changes in the cycles of companies and industries. Reacting too fast to changes could cause unnecessary buying and selling movements, destroying one’s investment strategy.
Finally, based on research, we are reasonably confirmed that the share price increase in the last five years has been primarily due to the growing earnings of solid businesses.
Does the research indicate which companies should be bought or sold now?
No, the research does not answer this. Everyone has to draw their conclusions. It could be tempting to invest, for example, in companies with a low valuation level that have a growing profit.
On the other hand, if the demand and profitability of companies are expected to decline in the future, prices and valuation levels may further decrease. Analyzing the companies’ money-making power in the future is the job we do in Sifter Fund.
In Sifter’s investment strategy, we believe that the company’s profit results from high-quality business, and share prices follow the company’s profit-making ability in the long term.
However, in the short term, the stock market is full of fear and hope, which reflects in the continuous movement of valuation levels and stock prices. Therefore we are long-term owners of quality companies.
If you want more detailed insights, download the 22-page case study report: Stock Valuation vs Money Making Power.
Santeri Korpinen
CEO, Sifter Capital

